
Barbican Consulting Limited
Gap Reports - How to use them

Gap Reports – How do you use them?
What it’s about
The gap report shows you interest rate mismatches between assets and liabilities. A 3 month deposit and 5 year fixed rate loan establishes the following interest rate gap:

Although we can see a mismatch between the asset and liability we do not yet have any means by which we can quantify the risk that is being run. How can we do this and therefore make the gap report more meaningful?
Quantifying the risk
Now we see the report from a slightly different perspective but the principle is the same. The assets and liabilities are in their respective time buckets. The summation gives the net position:

It’s what the balance sheet looks like but in a table rather than a graph. It makes it easier to carry out some analysis.
We can now discount the net position using market interest rates and repeat the process using interest rates that are a little higher. Let's do this.

You can see interest rates move from 5% to 6% and the respective discount factors for each time bucket. Multiplying the net amount by the discount factor provides the present value. It makes it easy to see the change in present value that occurs when interest rates move 1%.
The present value of the loan falls by £3.626m.
Whilst the deposit gains £0.233m.
What is the risk for the bank?

If interest rates increase 1% the bank loses -3,626,799 + 233,818 = £3,392,981
Does this look correct?
Yes, the bank is lending long term fixed rate money and borrowing short term variable rate money. A rise in interest rates will hurt. The gap report shows just how painful this could be. The bank may decide the interest rate risk is too great. Here is the original position, what could it do?

It could decide to match its 5 year loan with a 5 year fixed rate deposit. The asset and liability would net out leaving no interest rate risk:

Why don't banks do this and avoid the risk? Banks are usually reluctant to "match fund" loans because long term borrowing is expensive and this reduces net interest margins. This is why an alternative hedging strategy is often used. This involves the use of interest rate swaps.
Hedging with swaps
When a bank hedges this risk with an interest rate swap it pays fixed interest on the swap and receives Libor. The swap converts fixed interest to variable interest and this hedges the interest rate risk:
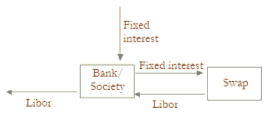
Lets see what this looks like on the gap report. The fixed swap payment nets with the fixed interest received on the loan. The Libor receipt on the swap nets with the Libor payment on the borrowing. Here is the position as a graph.

And here it is in a table.

Whether you look at the graph or the table the swap exactly offsets the loan and deposit. This means there is no net interest rate exposure. The bank is hedged against changes in interest rates.
When to hedge
Whether the interest rate risk is hedged will largely depend on two factors.
What is the risk appetite of the bank or society? The more conservative the business the lower will be the appetite for risk taking and the smaller the risk limits will be.
Within the risk limits what is the expectation for interest rate changes? If you anticipate falling interest rates, hedging the interest rate exposure using a swap may not be entirely appropriate. An unhedged position within limits is potentially more profitable. But it also presents a risk if interest rates do not move as predicted.
Limits on the interest rate gap
Because the gap report is showing an interest rate risk some firms apply a limit to the net asset or liability positions for each time bucket.

In the above example a tapering limit has been applied to the exposures. This means that the limit gets smaller the further you go out in time.
The reason for this is because longer dated mismatches are more sensitive to changes in interest rates and therefore present the firm with greater risk. In this diagram the circled area shows a break in the limit which needs to be corrected by hedging.
Strengths & Weaknesses
Gap reports are simple. They put assets and liabilities into repricing time buckets. For straight forward products it is easy to see your risk. Here is a gap report. Would the bank make or lose money if interest rates fell? What do you think?
The bank has a long dated asset funded by a short term liability so it would gain if interest rates fell. We could also calculate an approximate gain for a small change in the yield curve. It is this simplicity that makes gap reports popular with many managers. Is there anything else?
Yes, by observing how the gap report has changed you can see how your risk has altered day-to-day. Dealers who see an unexpected change in the report should check to see if the previous day's trades have been recorded correctly.
The weaknesses
The simplicity of the gap report is also one of its weaknesses. It cannot cope with option positions like caps and floors with the accuracy that many institutions require.
It also fails to show you the risks associated with loan pre-payments. The gap report only shows you the results of prepayment after it has occurred. What problem does this lead to?
If the gap report shows that fixed rate loans (like mortgages) have been repaid early the accompanying hedging transactions (like swaps) will be unnecessary. The swaps that hedged the original loan will now create an interest rate risk. Let's see this.
Here is the gap report showing a fixed rate loan hedged with a swap:

Here is the gap report after early repayment of the loan. The swap now creates an interest rate exposure.

What's the problem? You are only aware of prepayment after it has occurred. You are paying fixed interest on the swap and you will need to cancel the swap. Pre-payment is likely to occur when interest rates fall (customers refinance at lower rates). Cancelling the swap when rates are lower will cost you money. It would have been better to have seen this risk before it happened.
More weaknesses
Recall that taking the gap report and reporting the change in the value of the assets and liabilities after moving the yield curve gives you a numeric estimate of the interest rate risk:

This is all very well but changes you apply to the yield curve may have no resemblance to what actually happens. Therefore your profit and loss may differ significantly from any estimate that you made of the risk.
In addition as deals mature they can fall out of one time bucket into another. This can lead to big jumps from one day to the next in the risk that is being reported. It may even lead to dealers unwittingly breaching risk limits.
Basis risk
Many banks and societies are affected by basis risk. This occurs when you pay one type of interest rate and receive another. For example you pay Bank rate to savers and receive Libor on investments. This risk can lead to profits and losses. Let's look at a gap report and see if we can find this risk:

Can you see the risk?
No. The red circled area shows interest received and interest paid in the 3 month time bucket. But you cannot see what index they are linked to (Libor or Bank rate). The gap report therefore does not show you the basis risk being run.
Does this mean you shouldn't use gap reports?
No. Many firms produce gap reports for their management and apply limits to the gap risk.
The reports form an important tool for managing interest rate risk in these firms. Like all risk reports managers should be aware of both the strengths and weaknesses their gap reports contain. Complimentary risk reports should also be used. These may include basis point value reports, value at risk, earnings at risk, basis mismatch reports and stress testing.
First Published by Barbican Consulting Limited 2009